Project at the University of Pennsylvania, Fall 2022
Made in collaboration with Ann Zhang, Troy Wang, and Kathleen Scopis.
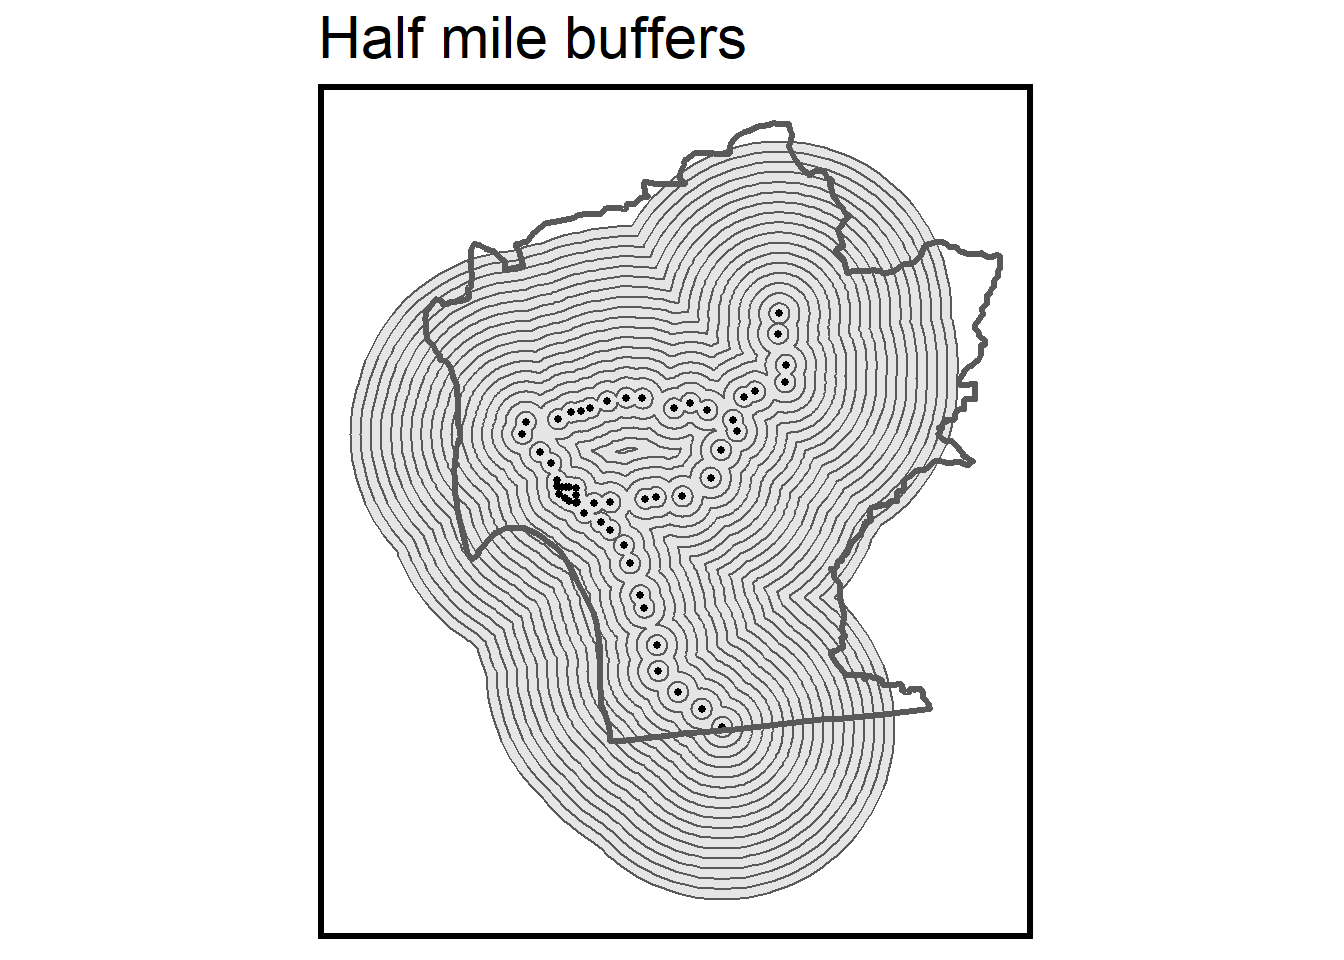
Personal contributions include data wrangling, map visualizations and regional analysis, trolley research, TOD tract selection code, ggplot visualizations, and multi-ring buffer analysis.
View the full markdown report here.
Summary

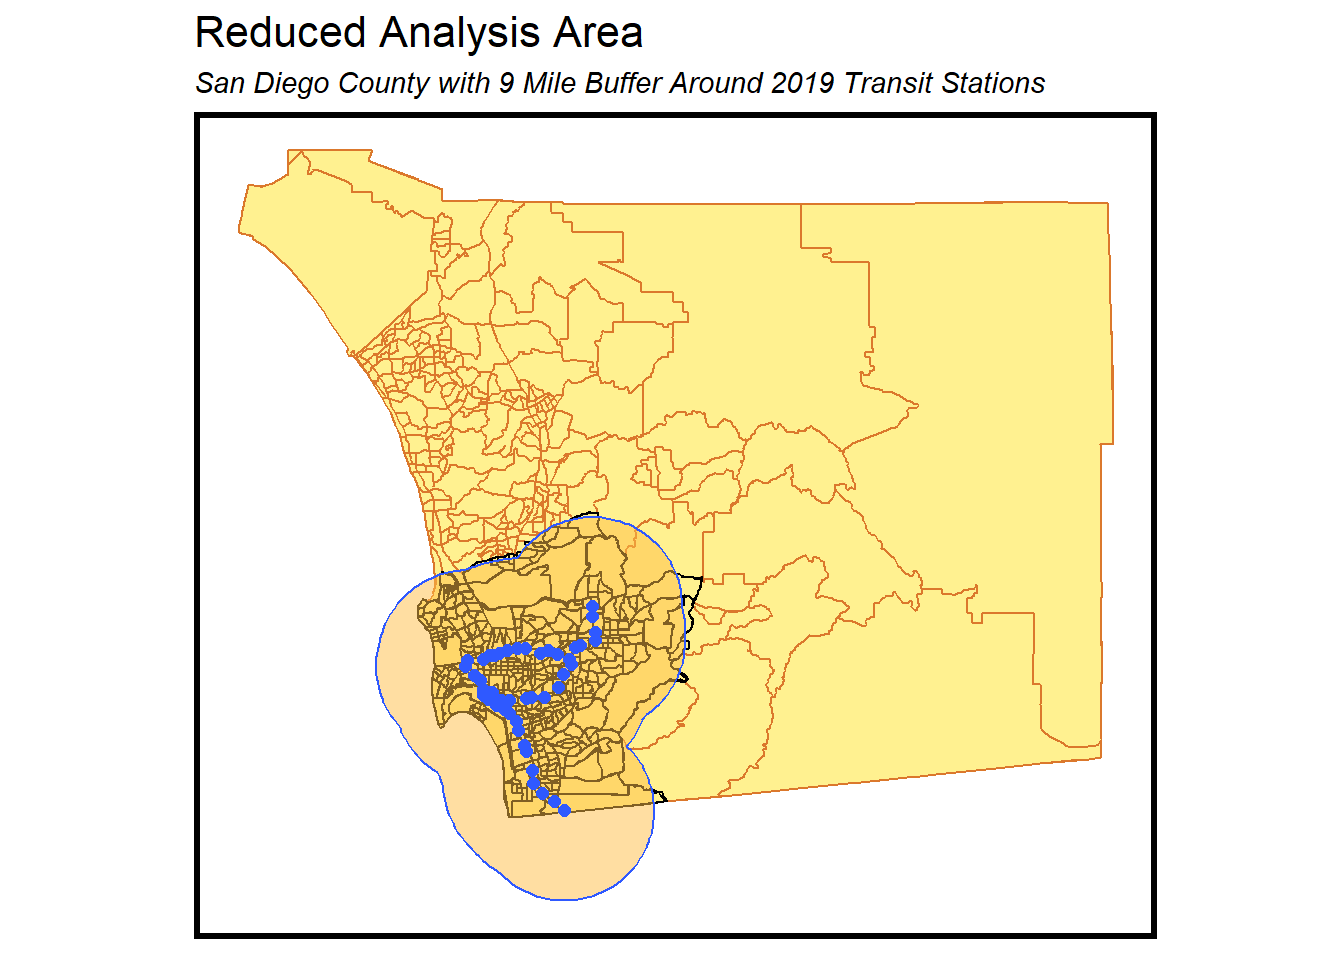
Map of San Diego County with our area of analysis outlined in black.
We originally used a 9-mile buffer around all three trolley lines and current stations to determine our area of analysis for San Diego County. Further research revealed that all Northern stations close to UCSD are recently constructed and would not have an impact on census data, so I further truncated the study area.

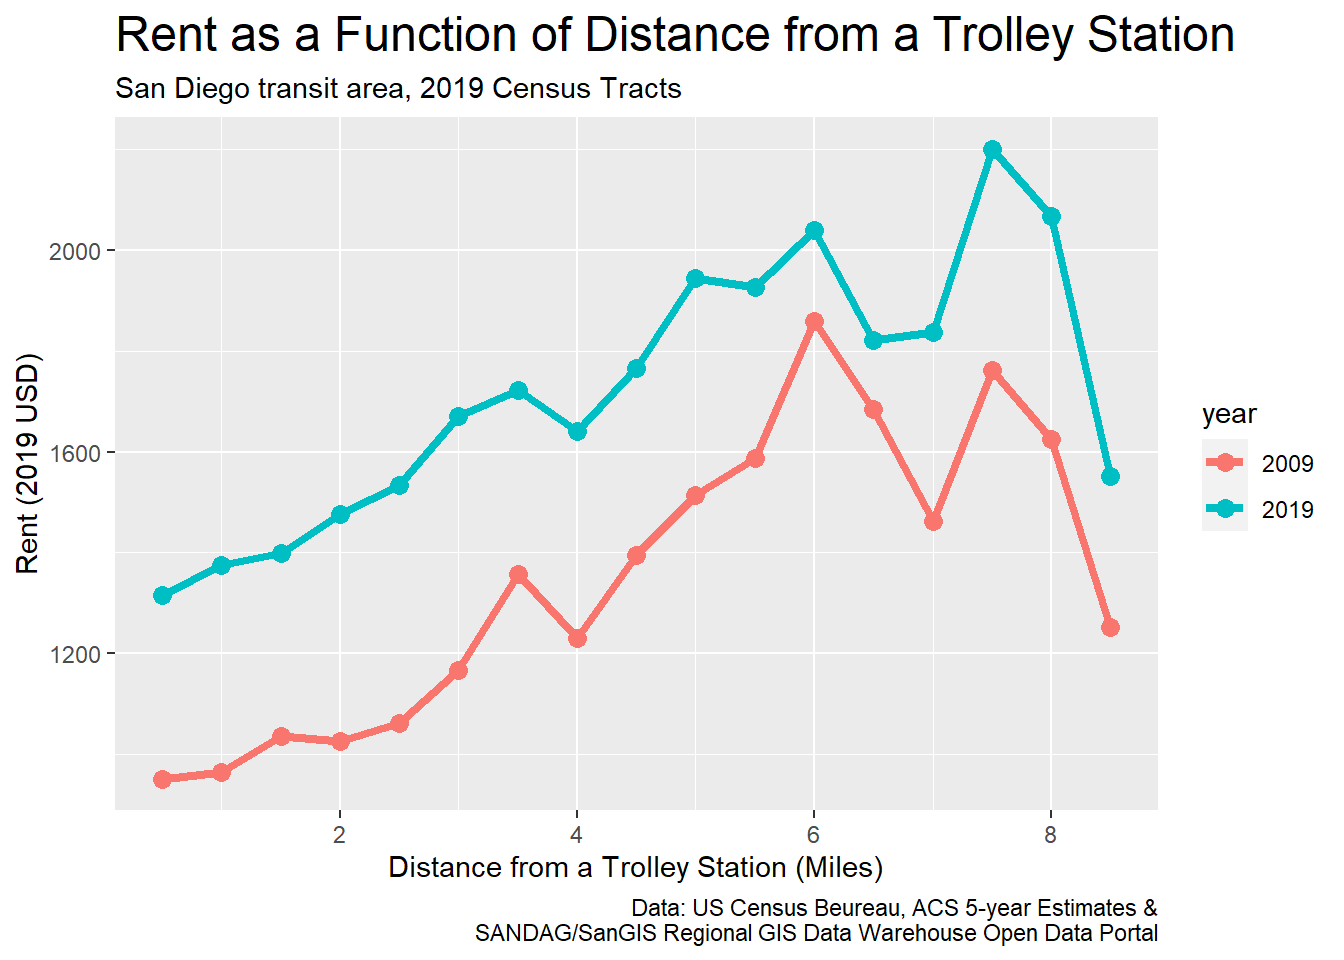
Our analysis found that rent is on average, lower in areas closer to the Trolley and higher in areas further away. This may indicate that other factors draw San Diego residents to areas outside transit-oriented development more than public transit access draws residents in.


Tools Used:
- R Tidyverse and Tidy Census Packages and Markdown for data wrangling and spatial analysis
- Mapbox Studio for map visualizations

