Project at the University of Pennsylvania, Spring 2023
By Myself, Myron Banez, Kendra Hills, supervised by professors Michael Fichman and Matt Harris.
In support of Assistant Deputy Commissioner Kathy Matheson, Senior GIS Specialist Andrew Newell, and Commissioner Adam Thiel of the Philadelphia Fire Department.
Link to R Markdown with in-depth data analysis and R code chunks.
Objective
In 2022, there were 1.2 million structure fires in the country. Last year major cities like Philadelphia and New York grappled with severe and dearly structure fires. In Philadelphia specifically, 41 people died from fires, while nearly 200 were injured, and thousands were displaced. Since working with the PFD we have learned that they wish to better understand the social and economic consequences of fire incidents in Philadelphia and in order to better inform strategic thinking and programming regarding fire prevention and post-fire recovery.
As it stands, the PFD has limited knowledge about what happens after their job is complete. There is no programmed set of economic development interventions that are used by public agencies in Philadelphia as a response to fire. As such, the PFD wants to better understand and predict consequences of a fire so that they or their partners can promote quick and equitable recovery.
Research and Analysis
Quantitative Research
Our team was given the incident level data of fires from 2009 through 2022 and asked to research if there were trends in the social impacts of these fires. Over a month, we studied the fire department’s data with various packages in R Studio to see if any apparent spatial trends existed within the single dataset. However, being stochastic events, fires as a whole have little spatial variation or strong seasonal variability. Still, we found that places with the greatest count of fires were commercial and educational buildings, but nearly 85% of structure fires happen at residential buildings. As a result of these findings, we chose to focus our research on smaller, non-condo residential buildings. There were still plenty of observations for effective analysis, fewer outliers, and, save for severity, a structure fire would affect the use of the property similarly across the whole data set.
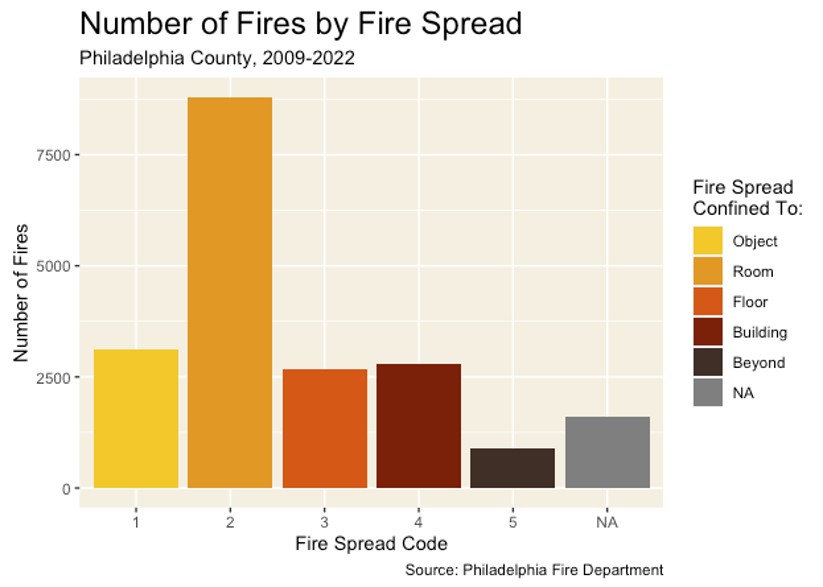
Finding the best measure of fire severity in the data was the next priority, as we hypothesized that a fire severity would cause a greater impact on the building and present more obstacles to recovery for the residents. Fire spread, a variable of five increasingly large categories, was the best option. This variable came in handy when forecasting outcomes later on.
Qualitative Research
The Fire Department also sought stories of social impacts of fires in order to connect our data analysis with the lived experience of its residents and check our quantitative findings. The Fire Department connected us with staff at the Red Cross House of Southwestern Pennsylvania, located in West Philadelphia, to potentially talk with victims of structure fires or their case managers.
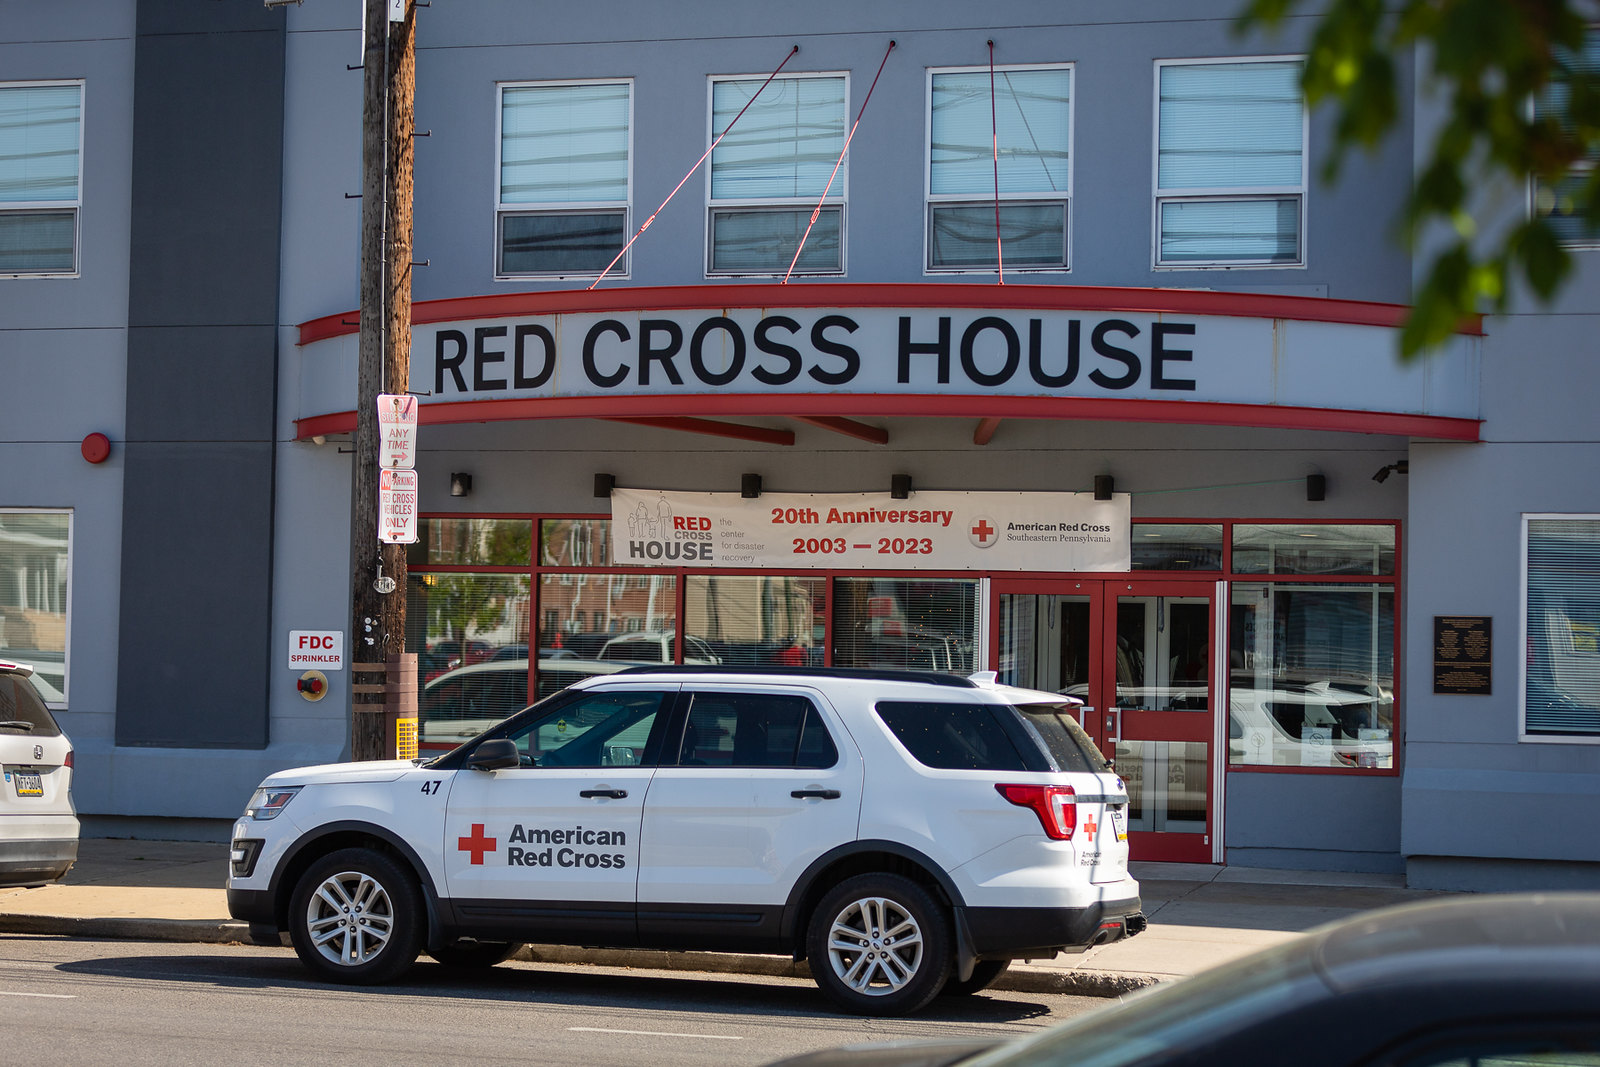
Red Cross House exterior. Photo by Konrad Jones/American Red Cross.
The establishment provides temporary housing and holistic counseling for displaced emergency victims with few resources.
We focused our interviews to just directors and senior case managers, as they could relay their clients’ broad range of experiences. They typically serve those who have very few resources, and told us that this demographic often does not have adequate renters or homeowners insurance to cover temporary housing or living expenses during the recovery period. Their clients want to move back into their homes, but high repair costs or slow-moving out-of-state landlords often prevent them from doing so. One senior case manager’s saying is “never get a landlord who lives in New York” because they don’t make fast repairs. Moving to a new place would then be the alternative, but the case managers see that finding affordable, secure housing is a struggle in the city.
“Never get a landlord who lives in New York.”
Seeing that many of these obstacles align with housing-related information, these conversations informed the next step of our search for additional data and measurable outcomes.
Defining Our Outcomes
We then turned to other data sources to evaluate a every fire’s impact on the residents. Our approach to determine social impacts was to study the association between structure fires and different outcomes for those buildings. Three outcomes that were readily available through open data were:
- construction permits
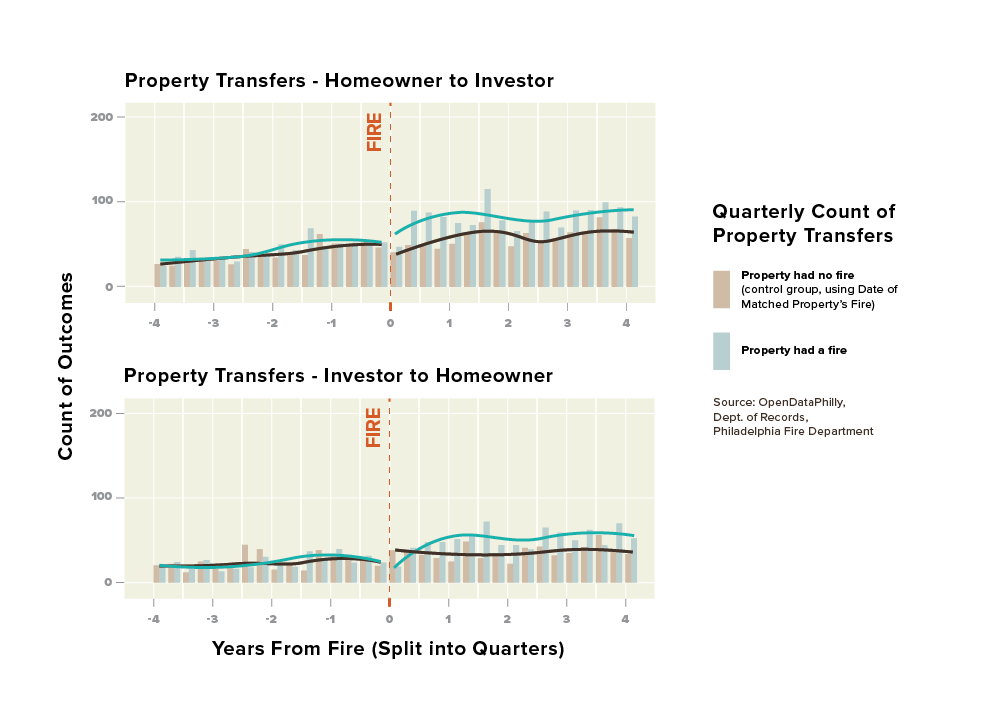
- property transfers
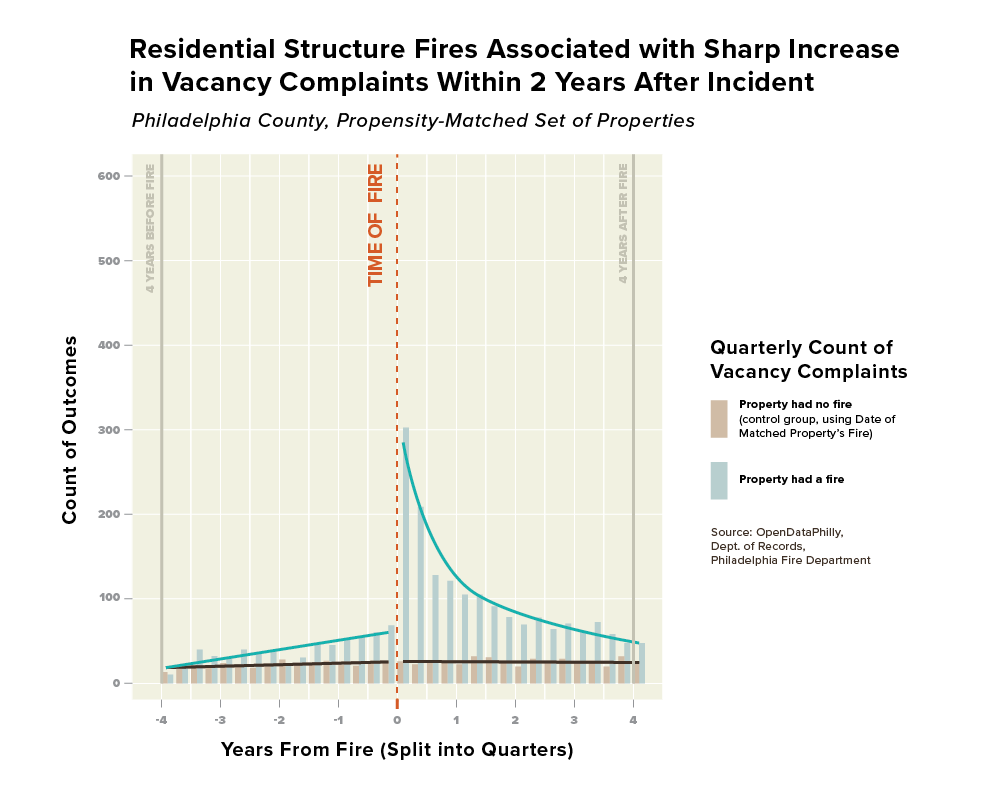
- vacancy complaints
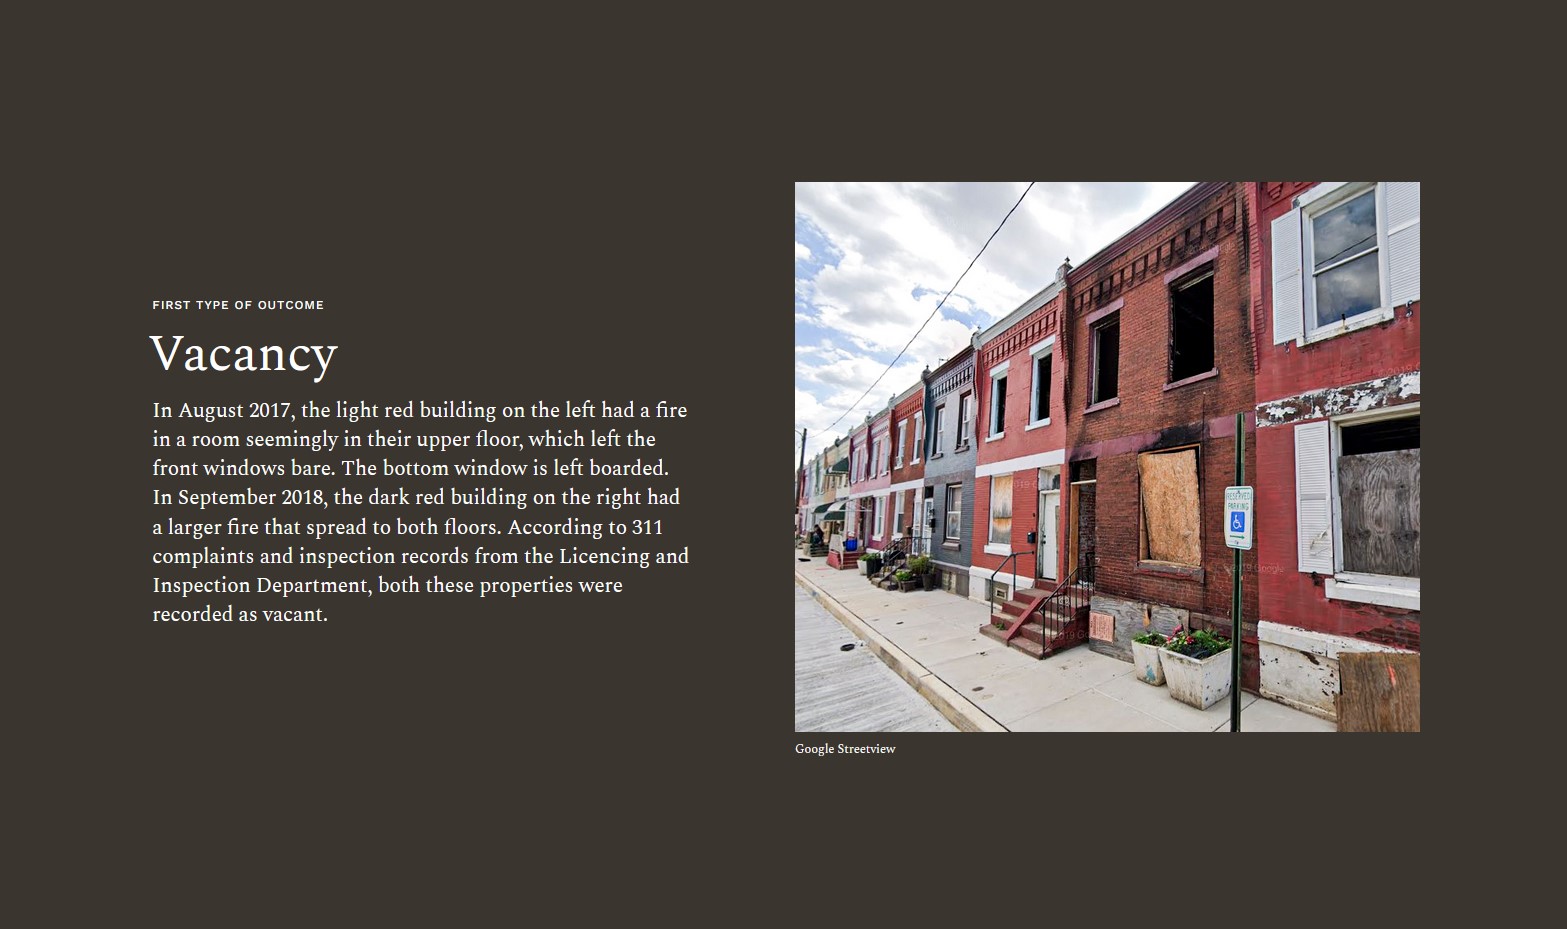
Each of these outcomes has a different social impact on the area around it. Construction permits signal that owners or landlords are financially equipped to repair the property and can recover, though the process may be difficult for anyone. Lingering vacancies may signal that residents are facing obstacles to recovery, and a vacant lot may have a negative impact on home values, local investment, and other local quality-of-life aspects. If properties are being repaired quickly, but the property is sold before repairs begin, then fires may contribute to increasing prices or decreased owner-occupancy of homes in an area.
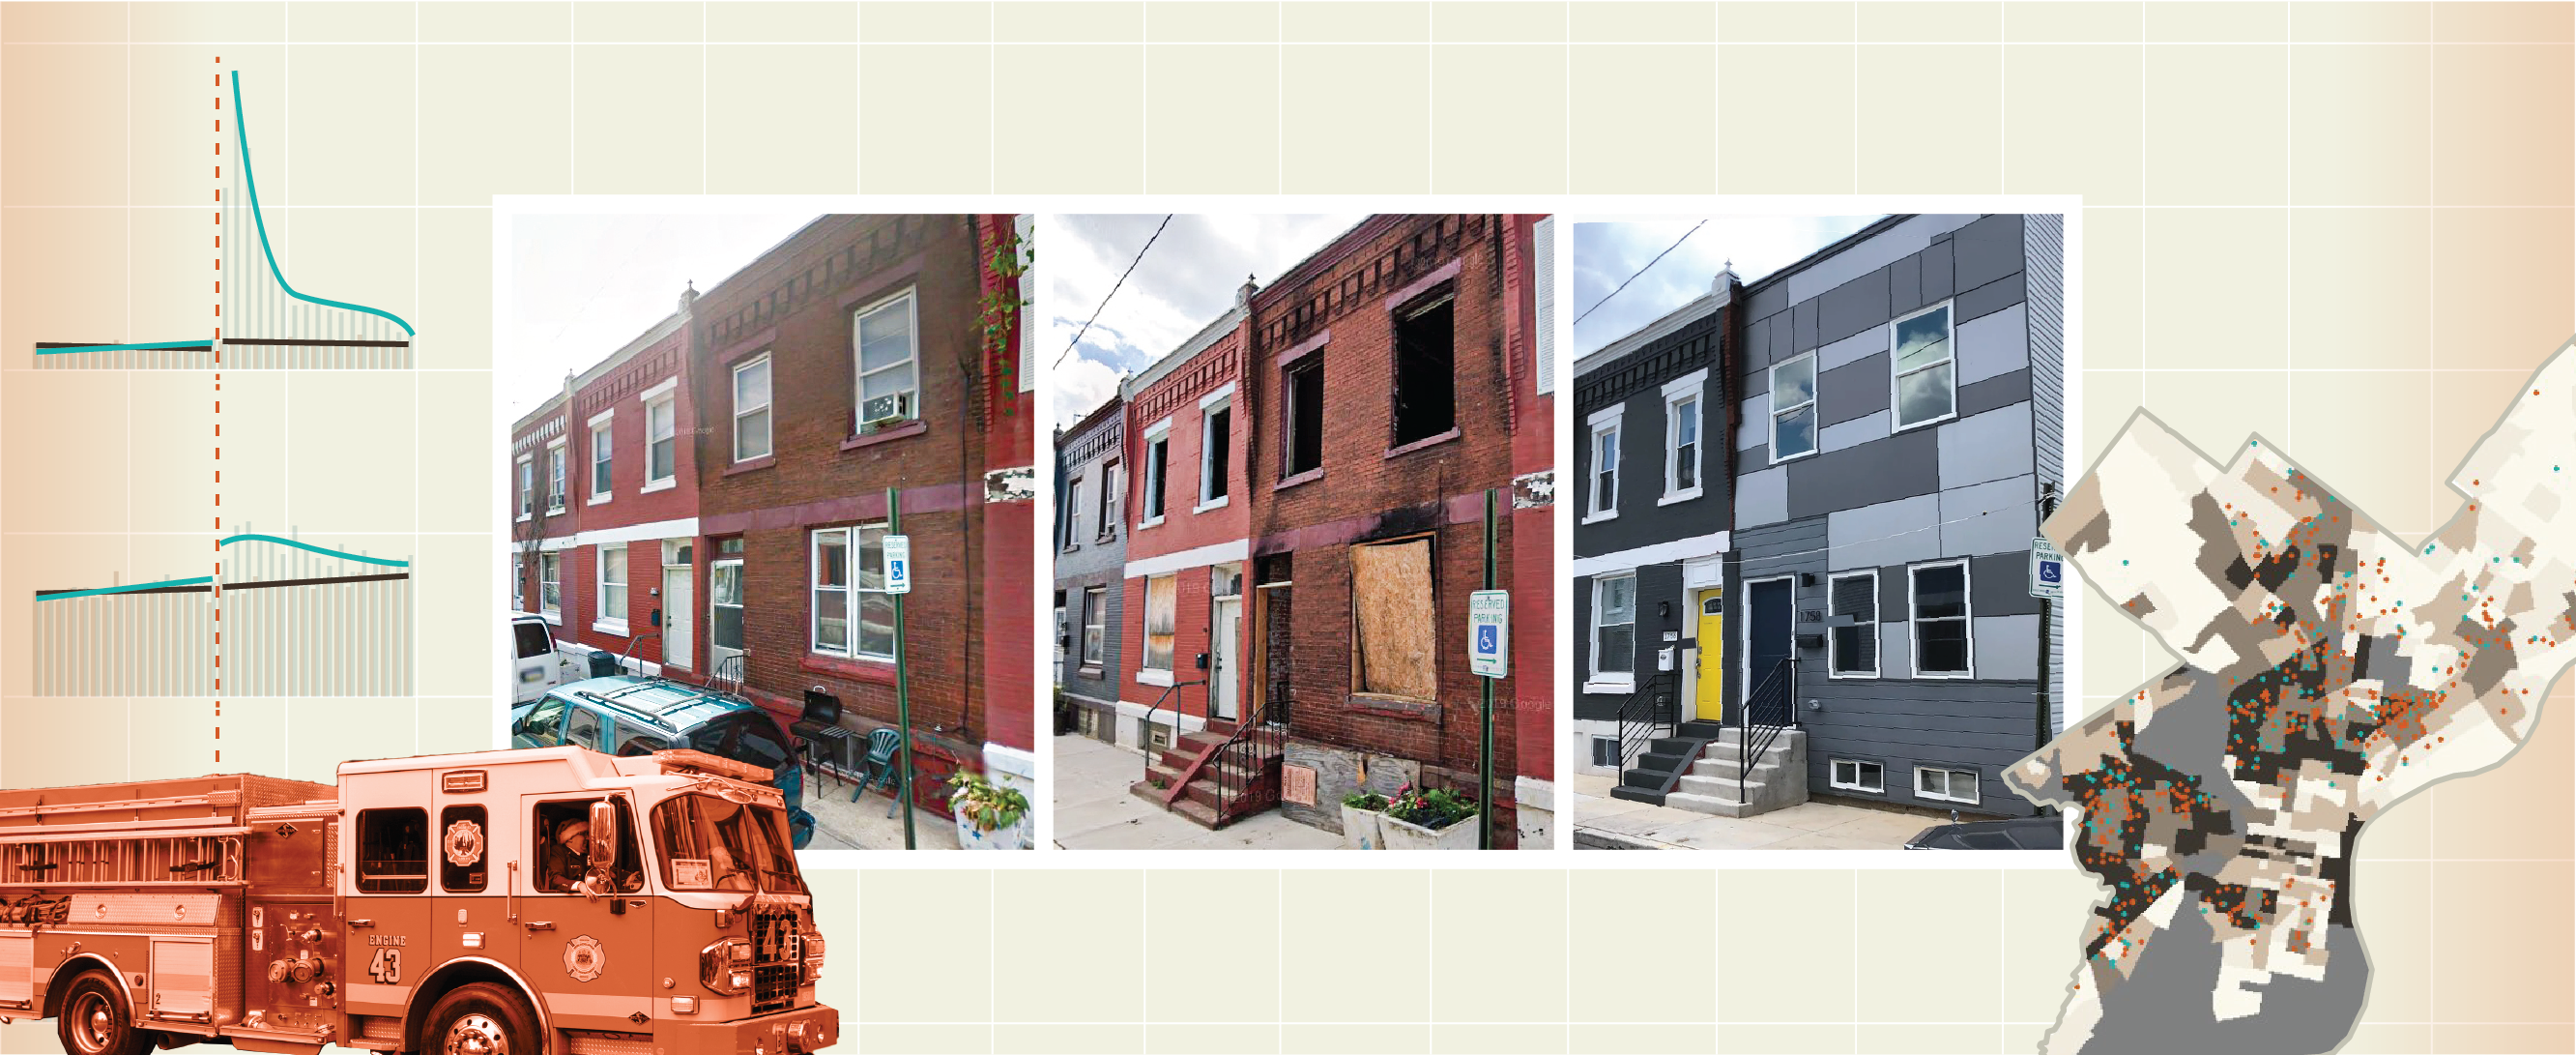
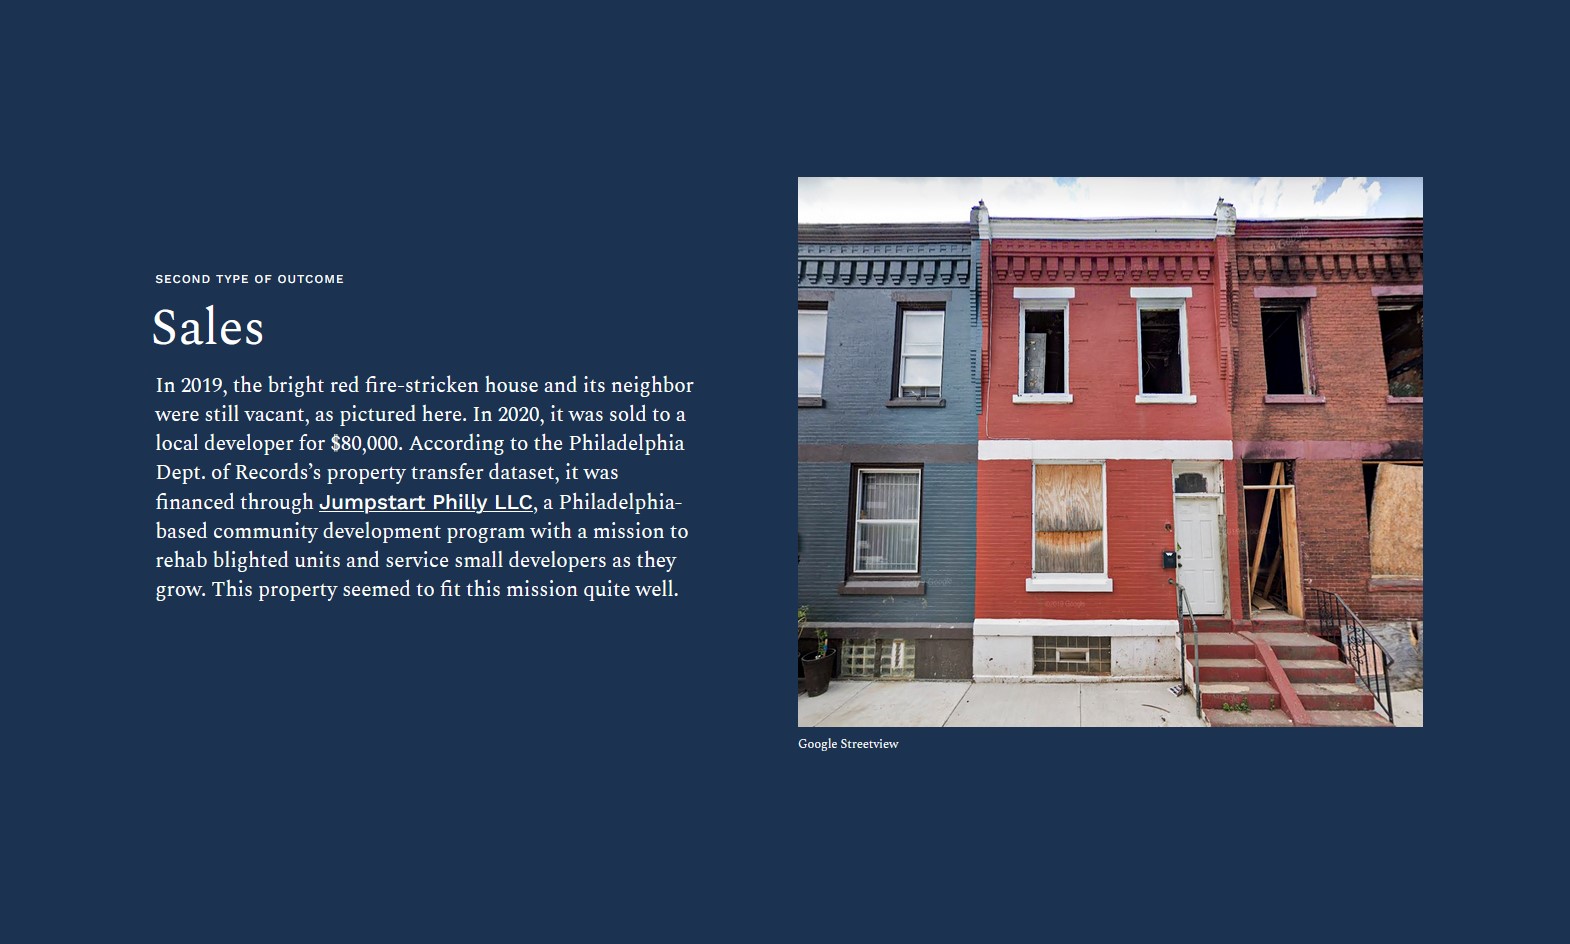
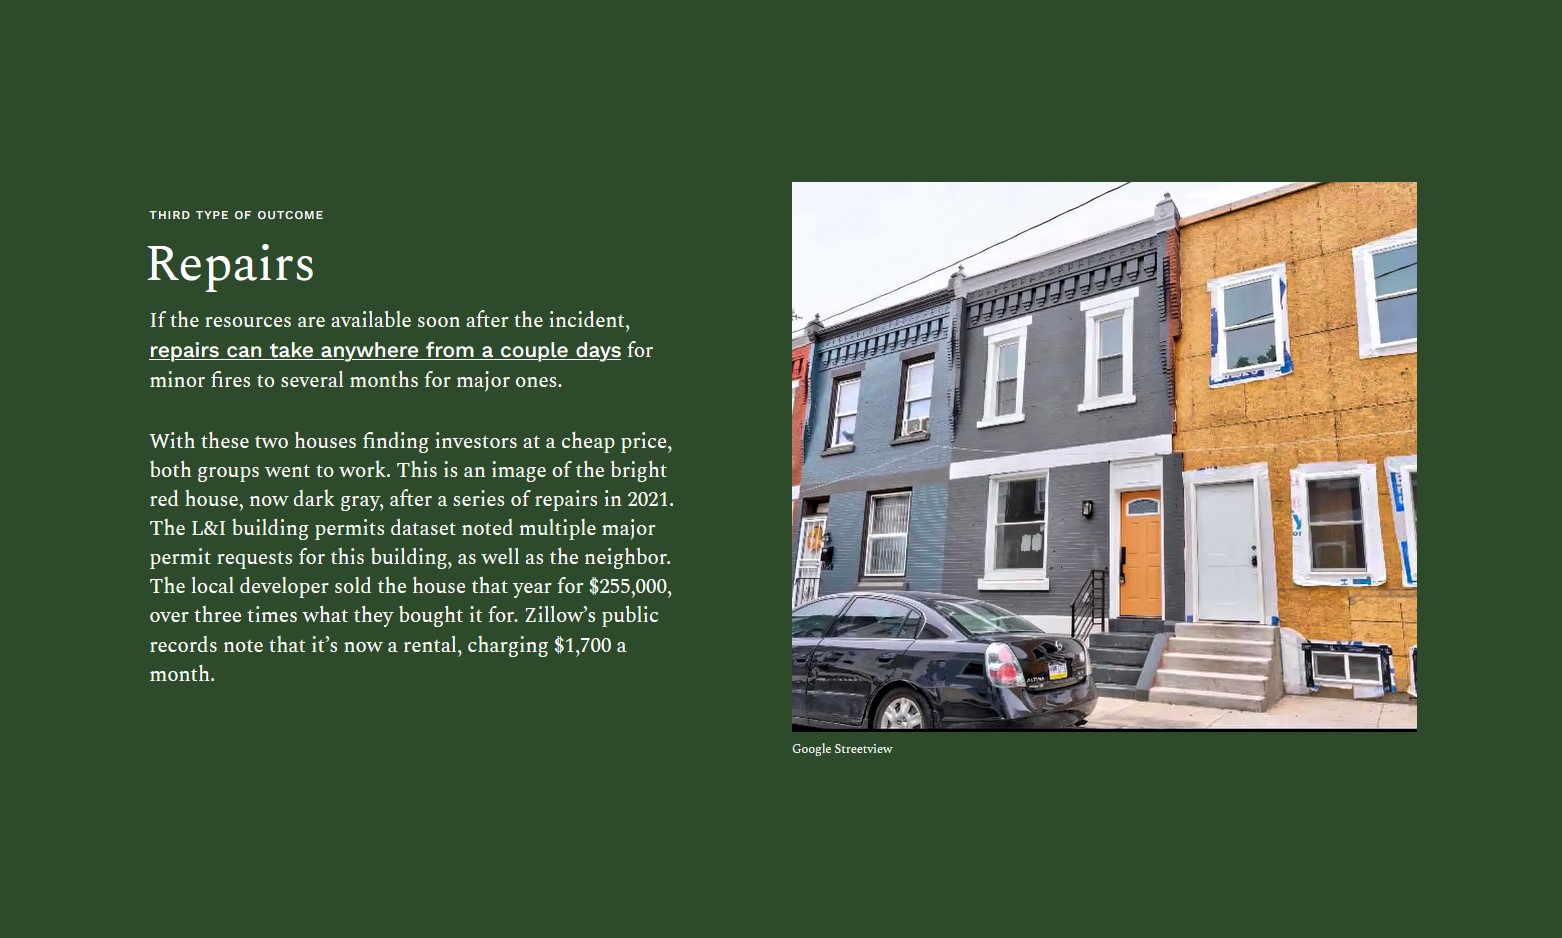
Exploratory analysis of our combined dataset revealed that a particular pair of homes in Northern Brewerytown both experienced fires between 2017 and 2018 and sat vacant for multiple years. They were then flip-sold between 2020 and 2022. See our project’s case study for the full story and additional perspective from case managers at Philadelphia’s Red Cross House.
Quasi-Experimental Propensity Matching To Connect Fires and Outcomes
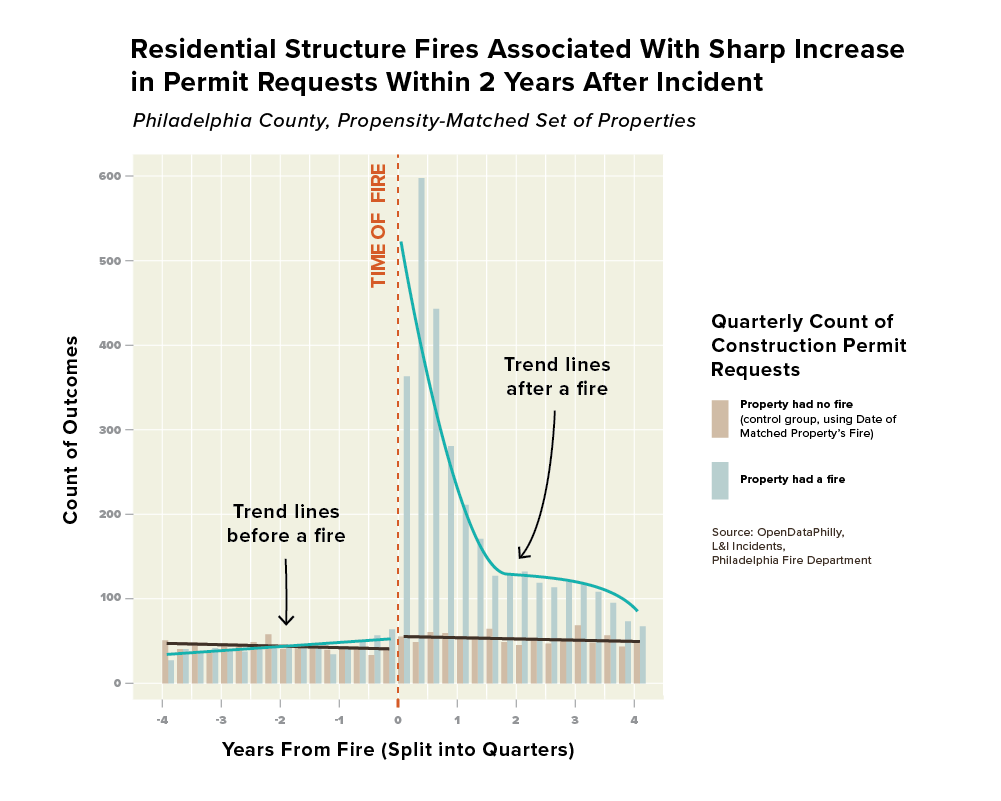
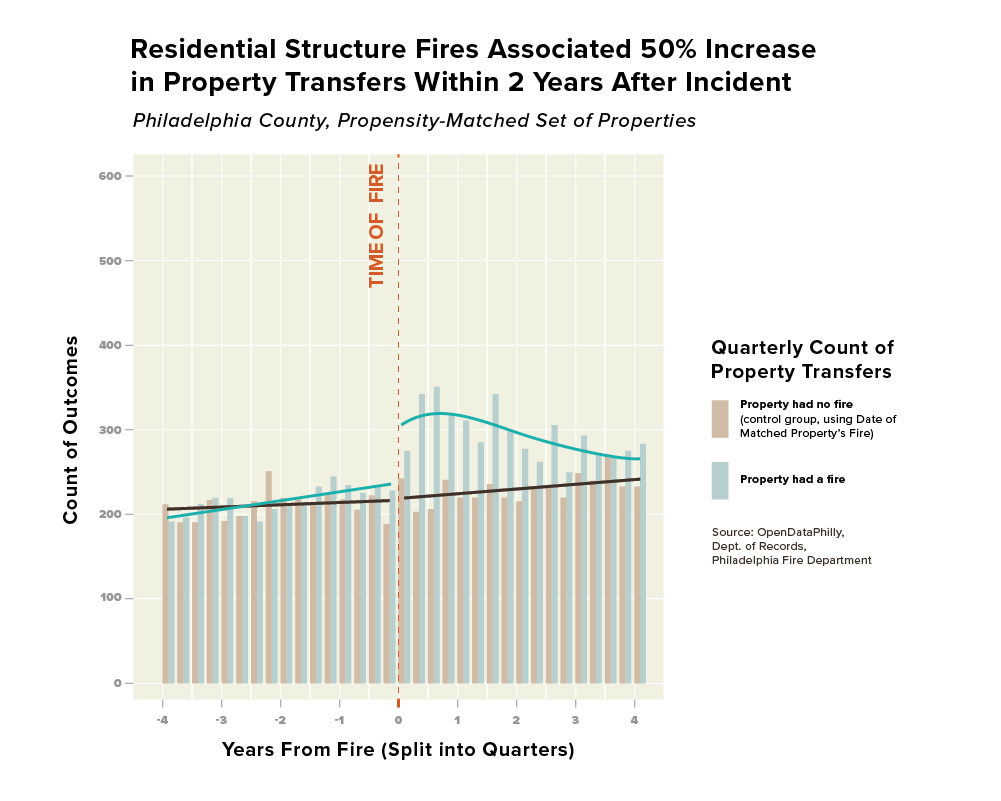
We tested the association between fires and each of these outcomes by creating a propensity-matched set of over 12,000 buildings with and 12,000 individually similar buildings without fires, then measuring the trends in these reports before and after each matched-pair’s fire. The results, as shown below, were that fires were associated with distinct increases in each of these outcomes:

These results could be broken down into different subcategories, as well. For example, our case study featured multiple sales between homeowners and investors. Our methods illustrated that fires are associated with an increased rate of homeowner-to-investor sales for years after the incident. Conversely, fires are initially associated with a decrease in investor-to-homeowner sales, but after six months, there is an increase in investor-to-homeowner sales in fire-stricken properties. This pattern may indicate a flip sale trend like the story we observed in our case study.
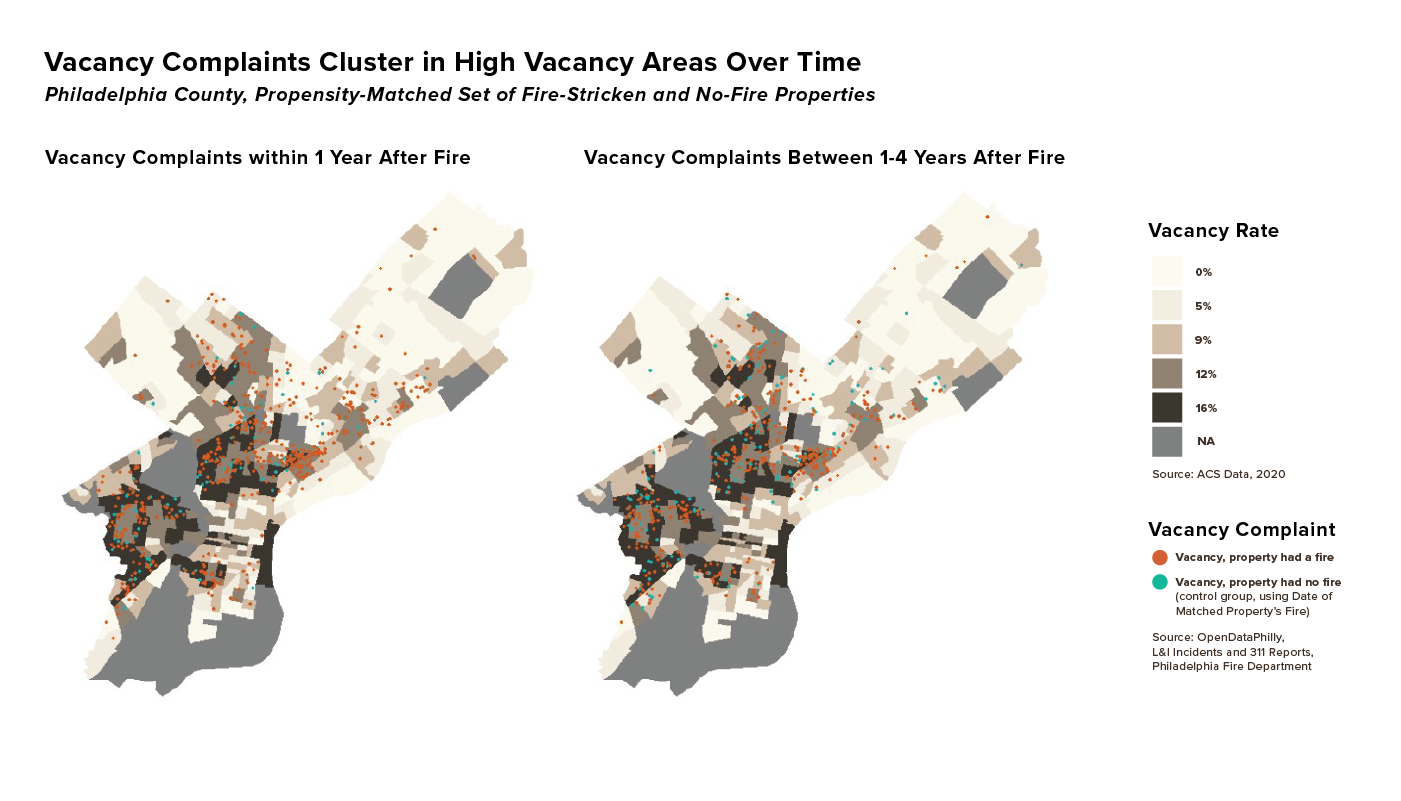
Spatially, we saw that most vacancies in fire-stricken properties persisted in areas of already-high vacancy. Otherwise, spatial trends were difficult to identify on a city-wide scale.
Modeling and App Development
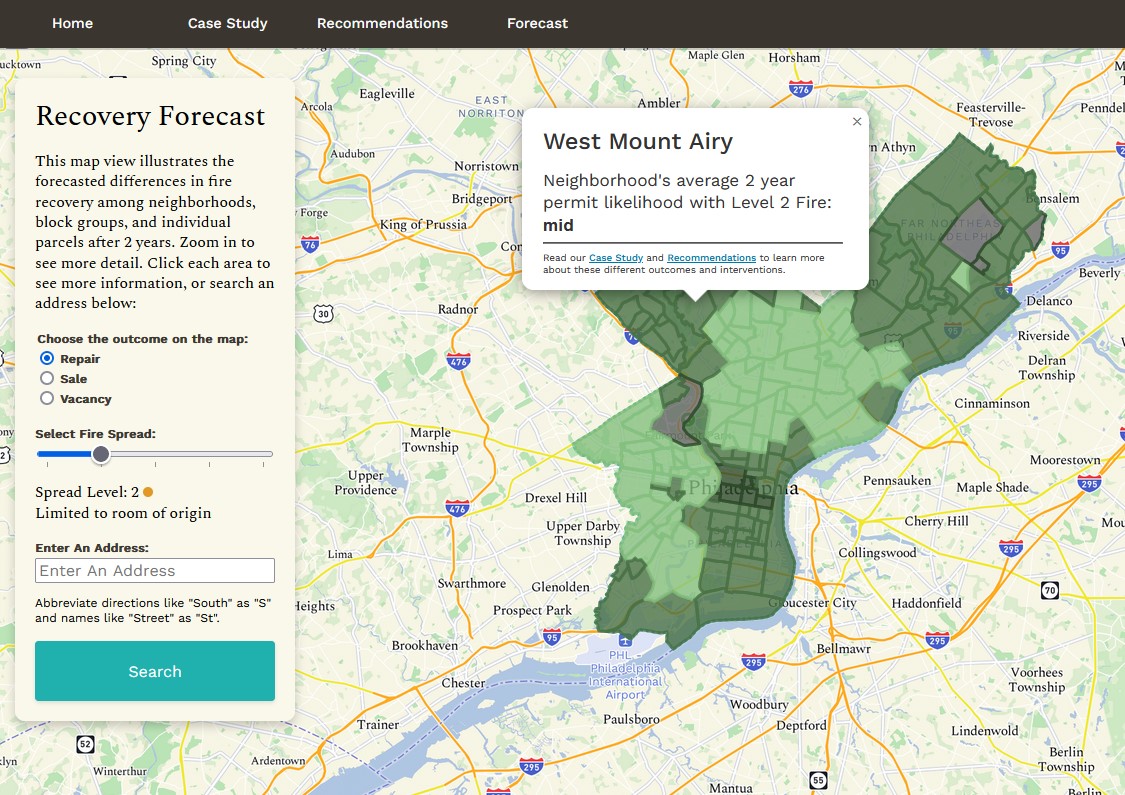
In order to give the Fire Department actionable forecasts, Myron and Kendra modeled each outcome (repairs, sales, and vacancies) across a series of predictors for each residential property in Philadelphia. Each of these models took in the attributes of the building, census variables of the community, and spatial proximity to schools and redevelopment areas, produced a likelihood of a permit (repair), a property transfer (sale), or a vacancy complaint, then classified that likelihood as a ‘yes, will happen’ or ‘no, will not happen’ based on an optimal threshold. We adjusted this threshold to be very sensitive so that it would accurately classify as many ‘yes’ results as possible, with the trade-off that more false positives would occur.
Here are our results:
| Modeled Outcome | Accuracy (AUC) |
|---|---|
| Vacancy (L&I or 311 Complaint) | 73.5% |
| Repair (Construction Permit Request) | 69.7% |
| Sale (Property Transfer) | 66.2% |
Our qualitative analysis revealed that this model could be improved with more data about residents’ insurance coverage, landlord and accurate owner-occupancy data, and local support networks.
I then visualized those predictions in a web-based application, allowing the Fire Department to search by address or understand patterns on a neighborhood, block-group, or parcel level. More details about the development are available on this project’s design and development page.
Recommendations
Responding to our analysis and research, the Fire Department and its partners can utilize current tools and consider new policies to allow their residents to better prepare for and recover from a residential structure fire:
Preparation:
- Broad communication about adequate homeowner and renter insurance would help Philadelphians prepare better for fires, especially in areas with high vacancy risk.
- Spreading awareness of existing proactive repair programs like Philadelphia’s Basic Systems Repairs program and Pennsylvania’s Whole Home Repairs program would prevent more fires from happening in Philadelphia’s relatively old housing stock.
- Giving local landlords an advantage over out-of-state landlords in the housing market may prevent lingering vacancies caused by lagging repairs.
Recovery:
- Lowering the cost of repair through non-profit variable programs, expert-led volunteer programs, or repair assistance programs mentioned above would enable faster recovery for those without emergency resources.
- Directing sales to local developers, land banks, and nonprofits may result in faster repairs, as seen in our case study.
- Lowering investment risk in fire-damaged homes through public or philanthropic loans would reduce their likelihood of long-term vacancy.
Tools Used:
- R tidyverse, ggplot, and markdown for statistical analysis, modeling, and publishing
- R MatchIt and tidyverse packages for propensity matching
- Expert interviewing and user interview scripting for qualitative research
- Adobe Illustrator for data visualization refinement, Photoshop for photo retouching